


gtest 的彩色信息显示看起来比较醒目,boost。test 的内存泄漏检查很实用。真希望两个功能在一个库里,可以省不少事情。不过如果想在作者们没有这么做之前结合使用这两个功能,下面的方法可以试。
1: #include <iostream>

2:

3: #include <gtest/gtest.h>

4: #pragma comment(lib, "gtestd_d.lib")

5:

6: #include <boost/test/unit_test.hpp>

7:

8: TEST(FooTest, test)

9: {

10: char *t = new char[2];

11: EXPECT_EQ(3, 3);

12: EXPECT_EQ(2, 3);

13: }

14:

15: using boost::unit_test::test_case;

16: void testf()

17: {

18: char *t = new char[2];

19: BOOST_CHECK(3 == 3);

20: BOOST_CHECK(2 == 3);

21: }

22:

23: using boost::unit_test::test_suite;

24: test_suite* init_unit_test_suite( int argc, char* argv[] )

25: {

26: std::cout << " gtest...\n";

27: ::testing::InitGoogleTest(&argc, argv);

28: ::testing::UnitTest::GetInstance()->Run();

29:

30: std::cout << "\n\n boost.test...\n";

31: test_suite* ts = BOOST_TEST_SUITE( "" );

32: ts->add( BOOST_TEST_CASE( &testf ) );

33: return ts;

34: }
(具体使用 test case 时只用 gtest 的即可,里面两者都写仅仅是为了有个对比)
gtest 1.3.0
http://code.google.com/p/googletest/
booost 1.8.0
http://www.boost.org/
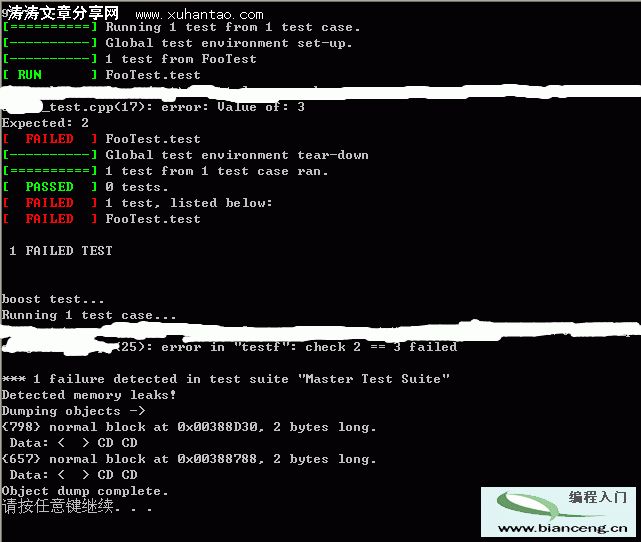
output:
windows mfc 程序定位实例 :
场景1:
Detected memory leaks!

Dumping objects ->

f:\dd\vctools\vc7libs\ship\atlmfc\src\mfc\strcore.cpp(141) : {1081} normal block

at 0x0038F448, 30 bytes long.

Data: <   x            > 0C 00 E5 78 06 00 00 00 06 00 00 00 01 00 00 00

f:\dd\vctools\vc7libs\ship\atlmfc\src\mfc\inet.cpp(509) : {1080} client block at

0x01268148, subtype c0, 28 bytes long.

a CHttpConnection object at $01268148, 28 bytes long

Object dump complete.


--

inet.cpp(509) : {1080}

inet.cpp 的第 509 行分配的内存

specified object allocation order number 1080

--
找到本机对应的文件
C:\Program Files\Microsoft Visual Studio 9.0\VC\atlmfc\src\mfc\inet.cpp
找到相应的行
CHttpConnection* CInternetSession::GetHttpConnection(LPCTSTR pstrServer,

INTERNET_PORT nPort /* = INTERNET_INVALID_PORT_NUMBER */,

LPCTSTR pstrUserName /* = NULL */, LPCTSTR pstrPassword /* = NULL */)

{

ASSERT(AfxIsValidString(pstrServer));

// line 509

CHttpConnection* pResult = new CHttpConnection(this,

pstrServer, nPort, pstrUserName, pstrPassword, m_dwContext);

return pResult;

}
如此应该是有这个函数的调用者没有清理返回的 CHttpConnection*,搜索调用代码发现果然如此
场景2:
内存泄漏检测信息中没有文件名及行号
Detected memory leaks!

Dumping objects ->

{1080} normal block at 0x00C28148, 1 bytes long.

Data: < > CD

Object dump complete.
在程序的开始加入 _CrtSetBreakAlloc(1080);
--
Start debugging
在此内存分配的位置(但不精确)会停下来提示
xxx.exe has triggered a breakpoint
当然,还是有文件名与行号省事,试试在文件适当位置加入
#ifdef _DEBUG

#define new DEBUG_NEW

#endif

//#define DEBUG_NEW new(THIS_FILE, __LINE__)
如此就可以象上面一样看到文件名及行号
Detected memory leaks!

Dumping objects ->

d:\work\xxx\xxx.cpp(167)

: {1080} normal block at 0x00C28148, 1 bytes long.

Data: < > CD

Object dump complete.
Sets a breakpoint on a specified object allocation order number (debug version only).
--
